Navigate the Digital Sea: Top Five Data Analysis Software Tools Shaping the Future of Information Handling
Python is a leading tool in data extraction, preparation, and analysis due to its flexibility and power. The language is free to use and boasts a robust and active community to support users. The Python ecosystem offers numerous libraries facilitating data analysis, including but not limited to NumPy, Pandas, and Matplotlib. NumPy enables complex numerical computations, while Pandas makes data cleaning and manipulation a breeze. Matplotlib, on the other hand, comes into play for data visualization, creating graphs and plots with ease. Therefore, these combined libraries make Python a magnificent tool in the journey of information handling.
Power BI: Microsoft's Contribution to the Information Age
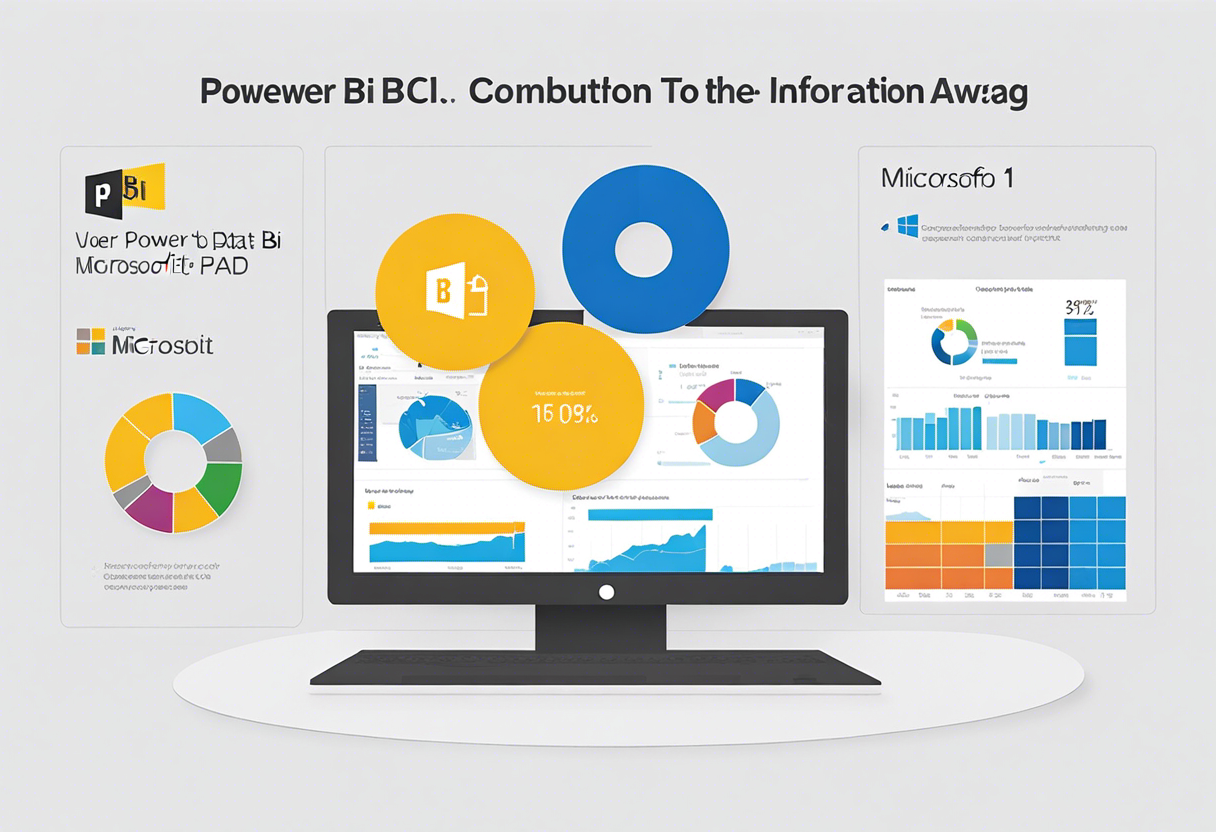
Power BI by Microsoft is an interactive data visualization tool in high demand for the ease-of-use and capability to convert raw data into meaningful insights. While suitable for both non-technical and technical users, Power BI offers features to connect several data sources, clean data, and generate interactive visual reports. Its real-time dashboard capability helps organizations to make informed decisions with the latest data. Moreover, its seamless integration with other Microsoft products boosts its usability and efficiency.
SAS: Bridging the Gap between Statistical Analysis and Data Management
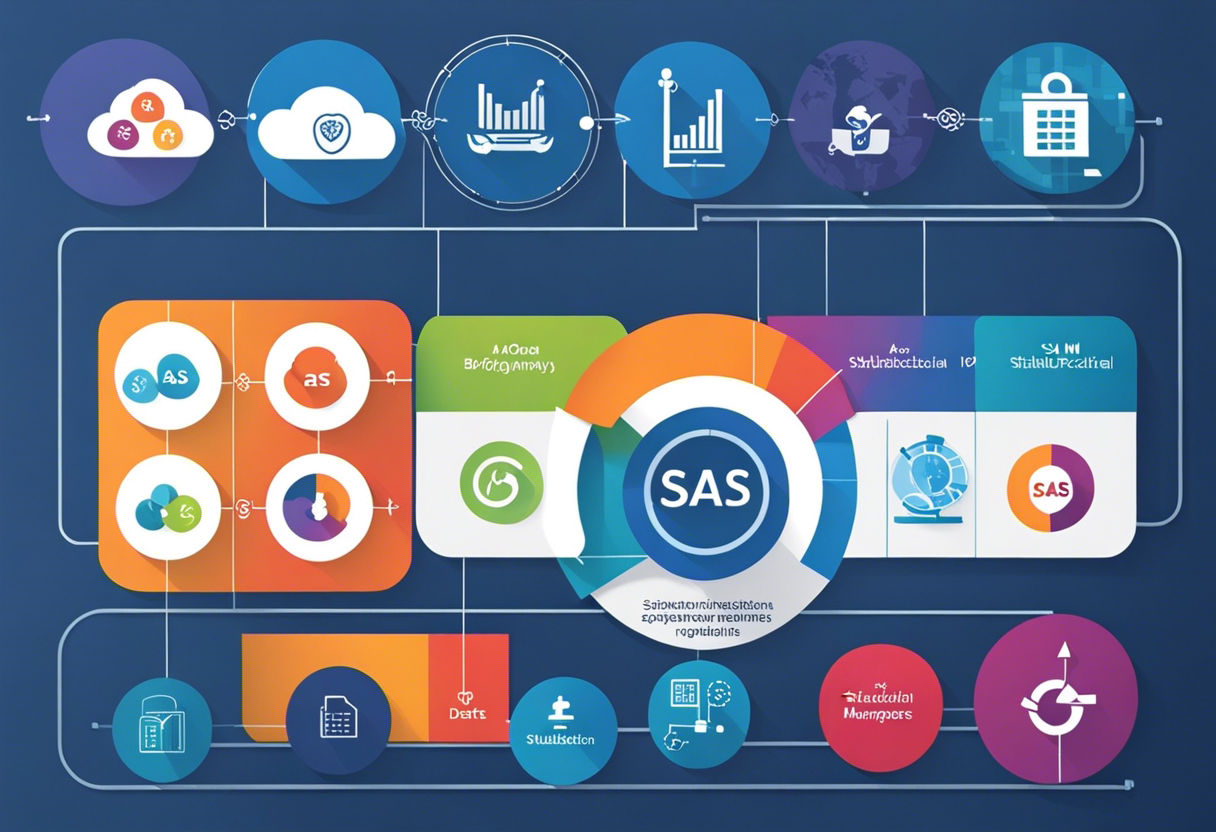
The Statistical Analysis System (SAS) is among the top software tools recognized for its analytics, business intelligence, and data management capabilities. It supports a wide array of data formats and has powerful analytics to derive insights from complex data. SAS's ability to handle large databases and perform complex calculations makes it indispensable in sectors such as healthcare, finance, and retail. Additionally, its GUI interface and proprietary programming language offer flexibility to users, making it a valuable tool in information handling.
Tableau: Simplifying Data Visualization
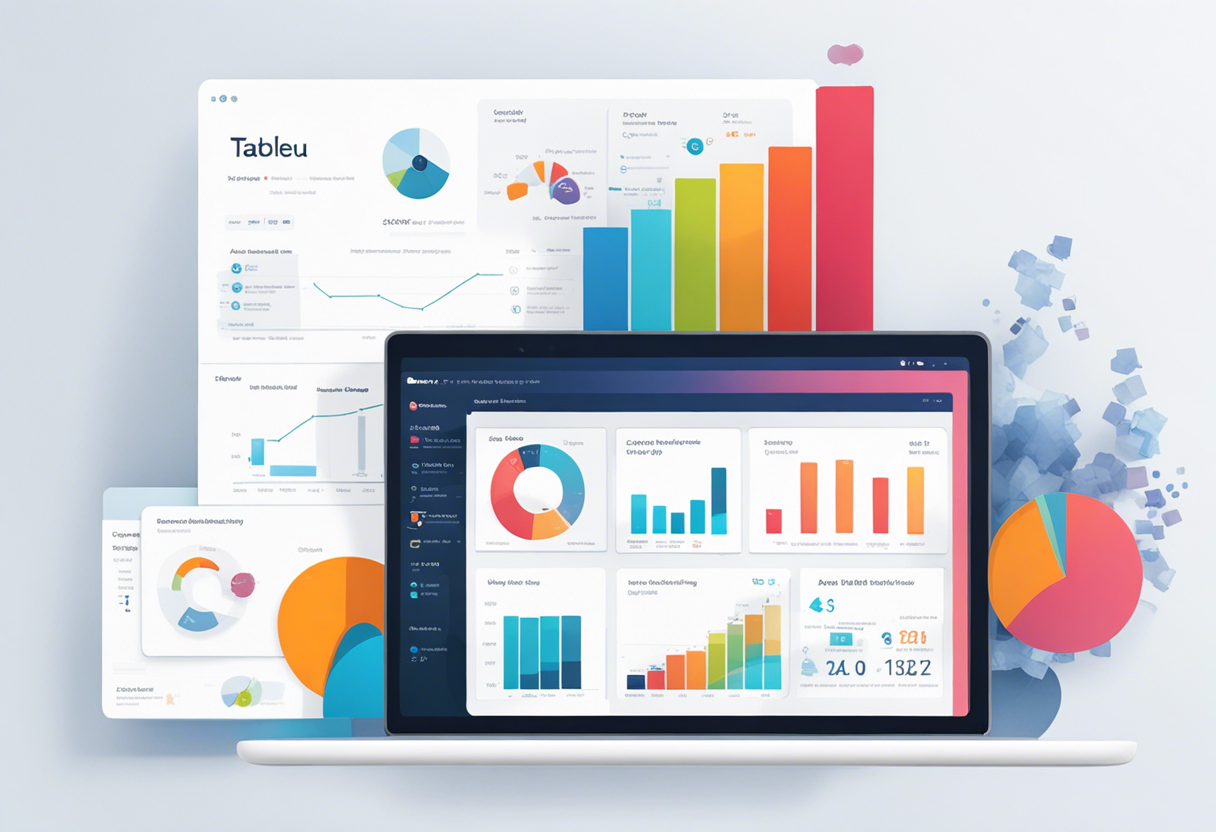
Tableau is another powerful data visualization tool that excels in turning raw, complicated data into digestible, visual insights. It supports data blending and real-time analysis, making it a perfect fit for businesses in today's data-focused world. Tableau is additionally known for its drag and drop interface, making it highly user-friendly. Its capacity to create interactive dashboards with drill-down capabilities ensures users can explore different layers of their data to extract actionable insights.
Apache Hadoop: Breaking Down Big Data
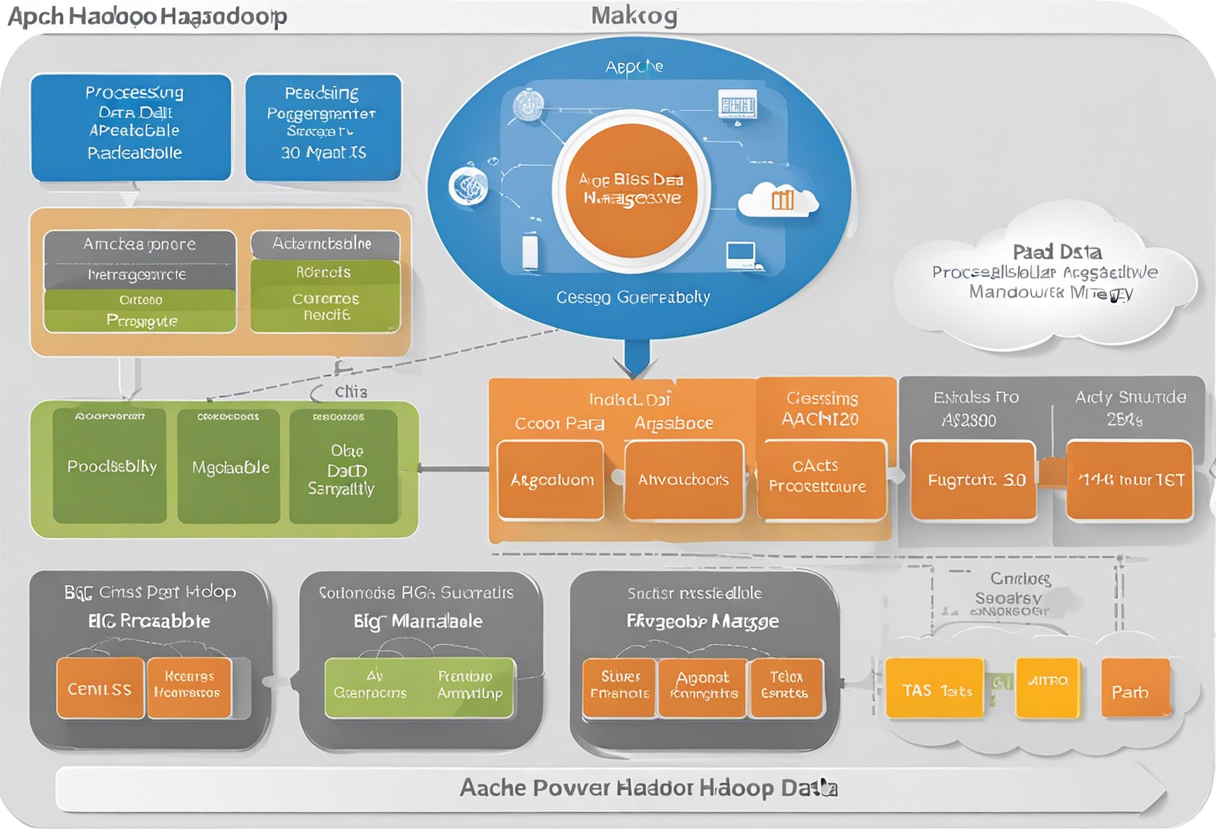
Apache Hadoop makes processing enormous quantities of data manageable. It functions with the principle of parallel processing, where it breaks down big data into smaller parts for quick and efficient analysis. Hadoop's primary components, like Hadoop Distributed File System (HDFS) for data storage and MapReduce for parallel data processing, make it a reliable tool for tackling big data challenges. Furthermore, its power to handle structured and unstructured data confirms its position in the future of information handling.
R: The Language of Statisticians
R, an open-source software environment, is extensively used for statistical computing and graphics. It is favored by statisticians and data miners to develop statistical software and data analysis. R's extensive package ecosystem makes it capable of executing complex statistical operations. Notably, R supports a broad range of data manipulations, including probability distributions, modeling, and machine learning algorithms. Above all, its data visualization toolset produces high-quality graphs, ensuring comprehensive detail, enhancing the data interpretation process.


