Decoding Success: Top 5 Strategies in Mastering Data Analysis
Before embarking on the journey of mastering data analysis, it's essential to establish a solid foundation. Understanding data is the cornerstone of this process. Data, by definition, is a collection of facts--numbers, words, measurements, or observations that translate into information.
The fundamental types of data are qualitative and quantitative. Qualitative data is often descriptive, presenting perceptions, opinions, or reasoning, while quantitative data is statistical, conveying quantities, amounts, or ranges. The scope of data is vast, and learning to differentiate and comprehend these types of data marks the first step in your journey.
Also crucial is understanding the significance of data quality. Inaccurate or irrelevant data can lead to misleading insights or faulty decisions. Always ensure that your data is reliable, complete, and relevant to ensure your analysis delivers accurate representations.
Getting Technical - Data Collection and Cleaning

A key part of mastering data analysis is understanding the methodologies for data collection, and the significant process of data cleaning. Data can be gathered via surveys, questionnaires, direct observations, databases, or even online. Familiarize yourself with different collection techniques to ensure you gather the most accurate, representative data possible.
Post collection, data cleaning is critical. Many datasets contain missing, irrelevant, or erroneous data points. Savvy data analyzers use specific algorithms or software to identify and handle these anomalies, ensuring that the data is accurate before proceeding with analysis.
Visualization - Seeing the Story in Your Data

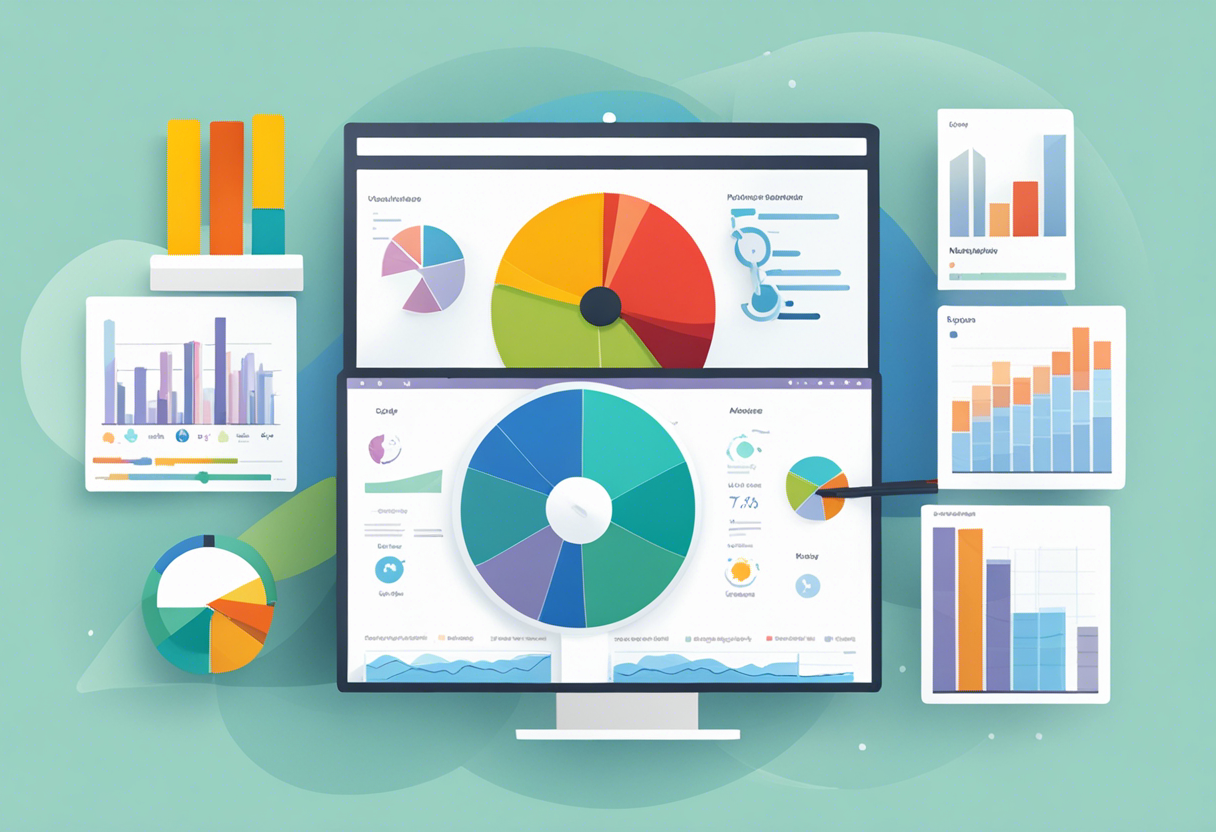
Visualization is an instrumental strategy in data analysis. Through graphs, charts, and other visuals, we can better understand data, discern patterns, make comparisons, and convey complex ideas simply and dramatically. Tools such as Microsoft Excel, Tableau or PowerBI enable non-statisticians to visualize data efficiently.
Understand that different types of data require divergent representation methods. For instance, pie charts may be great for displaying proportions, while line graphs are better suited for trend identification.
Hypothesis Testing - The Heartbeat of Data Analysis

Hypothesis testing is the key to drawing conclusions from your data. It involves setting up a null hypothesis (the status quo), and, through statistical analyses, determining the probability that it holds true. Rejecting or failing to reject the null hypothesis can provide meaningful insights about your dataset.
Many techniques, such as t-tests, chi-square tests and ANOVA, can be employed. Knowledge and correct application of these practice make your data analysis robust and reliable.
Predictive Analytics - The Crystal Ball

The ultimate goal of mastering data analysis is often predictive analytics--using your data to forecast trends or predict future outcomes. Everything we've mentioned before leads to this point. By implementing statistical algorithms and machine-learning techniques, we can decipher patterns in historical data and make informed prognoses about the future.
Understanding the appropriate method for the intended application (eg. linear regression for continuous outcomes, logistic regression for categorical outcomes) is necessary. Confidence in your predictive models arises from firm mastery of each step in the data analysis process.
We have traversed the journey from understanding the basics of data, through the technicalities of collection and cleaning, employing effective visualizations, conducting robust hypothesis testing, and finally mastering predictive analytics. These strategies provide the keys to unlock your potential in mastering data analysis. Notice how the strategies build upon each other, leading ultimately to actionable insights that can significantly impact decision-making.


