Decoding Success: Top 5 Strategies in Mastering Data Analysis
January 17, 2024
Visualization - Seeing the Story in Your Data

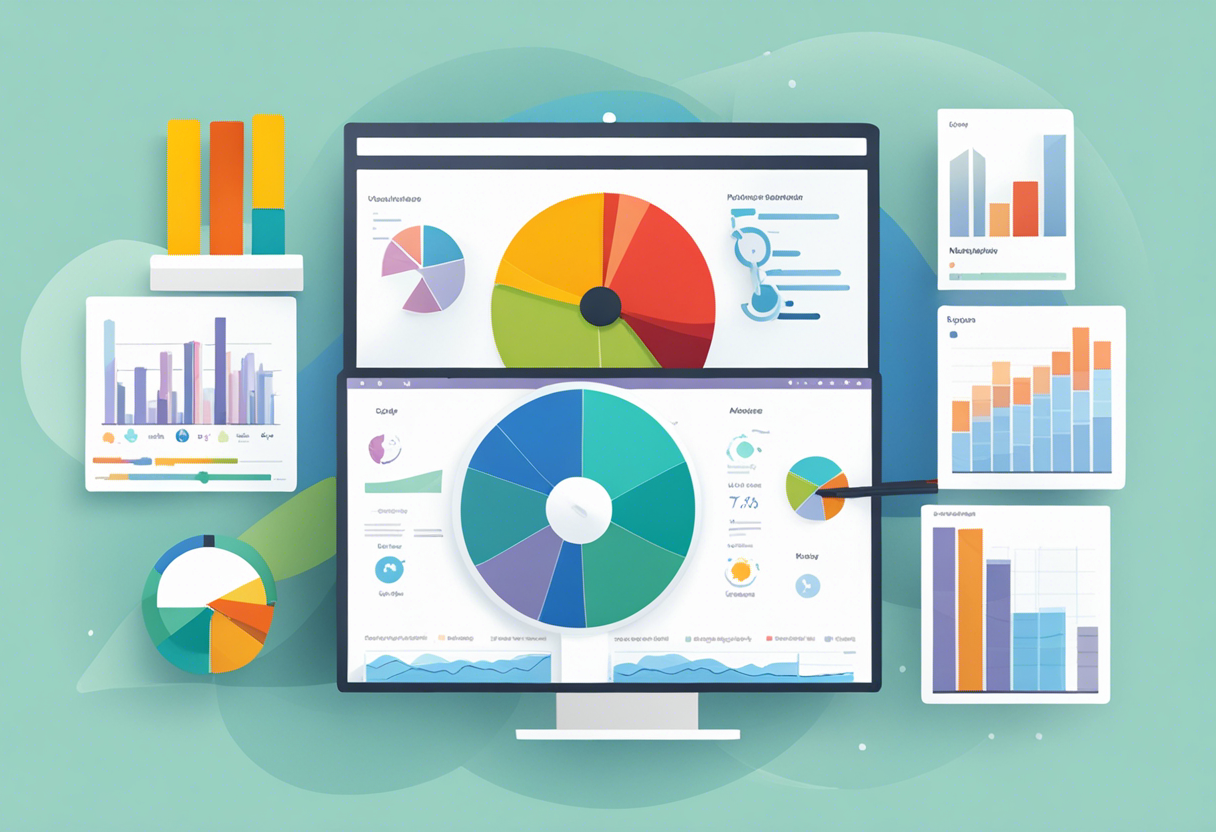
Visualization is an instrumental strategy in data analysis. Through graphs, charts, and other visuals, we can better understand data, discern patterns, make comparisons, and convey complex ideas simply and dramatically. Tools such as Microsoft Excel, Tableau or PowerBI enable non-statisticians to visualize data efficiently.
Understand that different types of data require divergent representation methods. For instance, pie charts may be great for displaying proportions, while line graphs are better suited for trend identification.